I know what you’re thinking: “Twitter has analytics?!”
Yes, yes it does. Now, in addition to the plethora of free social media tools at our disposal, Twitter offers an in-depth view of how your Twitter account is performing.
Getting started with the platform is easy. As long as you have an existing account that’s more than 14 days old and isn’t deleted, restricted, protected, or suspended, just sign in with your account credentials at https://analytics.twitter.com/aboutabout/about.
After you log in, click Get Started on the Analytics homepage.
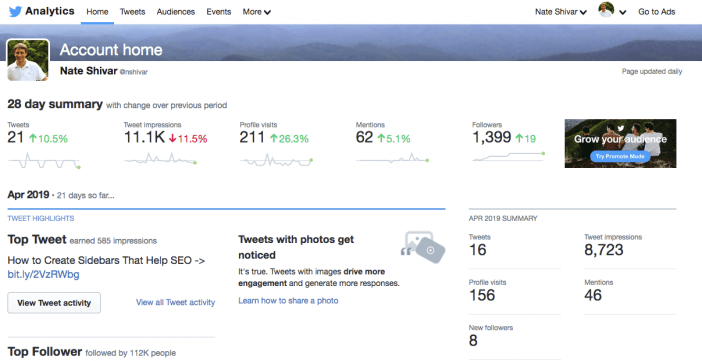
This will bring you to your account homepage, where you’ll see a summary of your account, as well as a breakdown of additional data.
Twitter Analytics Definitions
Before we dive too far into the analytics platform, let’s define some key metrics Twitter covers.
Impressions
The number of times users saw the Tweet on Twitter.
Engagements
The total number of times users interacted with a Tweet, which includes all clicks anywhere on the Tweet (including hashtags, Tweet expansion, links, avatar, and username), retweets, replies, follows, and likes.
Engagement Rate
The number of engagements divided by the number of impressions.
Tweets Linking to You
The number of Tweets linking to URLs that have Twitter Cards* linked to your account.
*Twitter Cards are HTML codes you attach to your webpage. Users who Tweet links to these pages have a “Card” added to the Tweet.
Top Tweet
Tweet that received the highest number of impressions.
Top Media Tweet
Tweet with a photo or video that received the highest number of impressions.
Top Card Tweet
Tweet with a Twitter Card (linked back to your website) that received the highest number of impressions. This can include other people’s Tweets promoting your content with a Tweet Card attached.
Top Mention
The Tweet that mentions your Twitter handle and received the highest number of impressions.
Top Follower
The account with the highest follower count that followed you in a given month.
When you log into your account, you’ll notice you enter on the home tab, which gives you a 28-day summary of Tweets, Tweet impressions, Mentions, Followers, and Tweets linking to you. This quick snapshot also shows a percent increase or decrease compared to the previous 28-day period.
If you scroll down the page, you’ll see Tweet highlights for the last three months, as well as for the current month. Or, you can navigate to the three other dashboards: Tweets, Audiences, and Events.

Understand & Use Your Tweet Data
Let’s talk first about the Tweets data. In this tab, you’ll find an overview of how your individual Tweets are performing. The data is automatically set to cover the last 28 days, but you can adjust it by using the calendar icon in the top right corner.
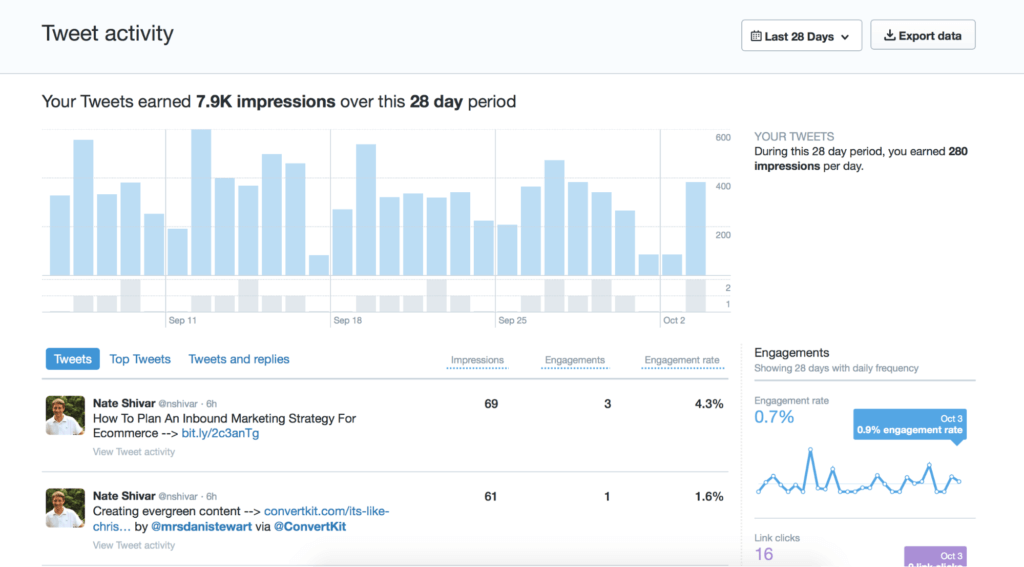
The bar graph gives a breakdown of Tweets (in gray) each day and their corresponding impressions.
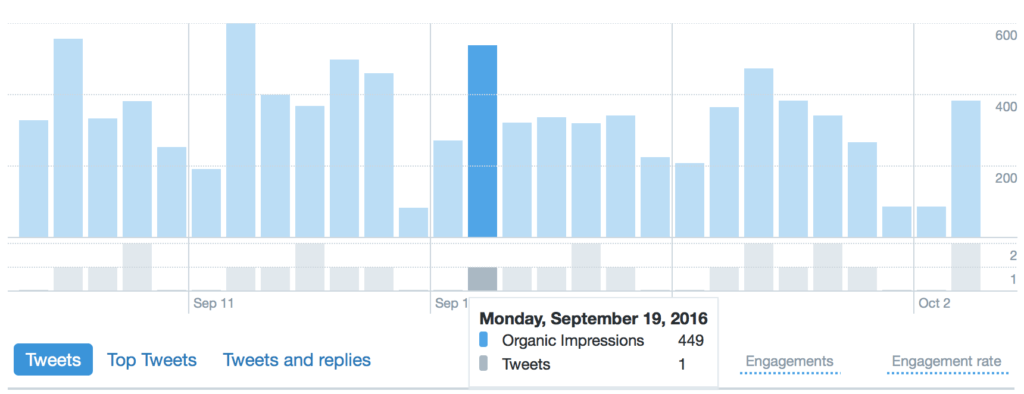
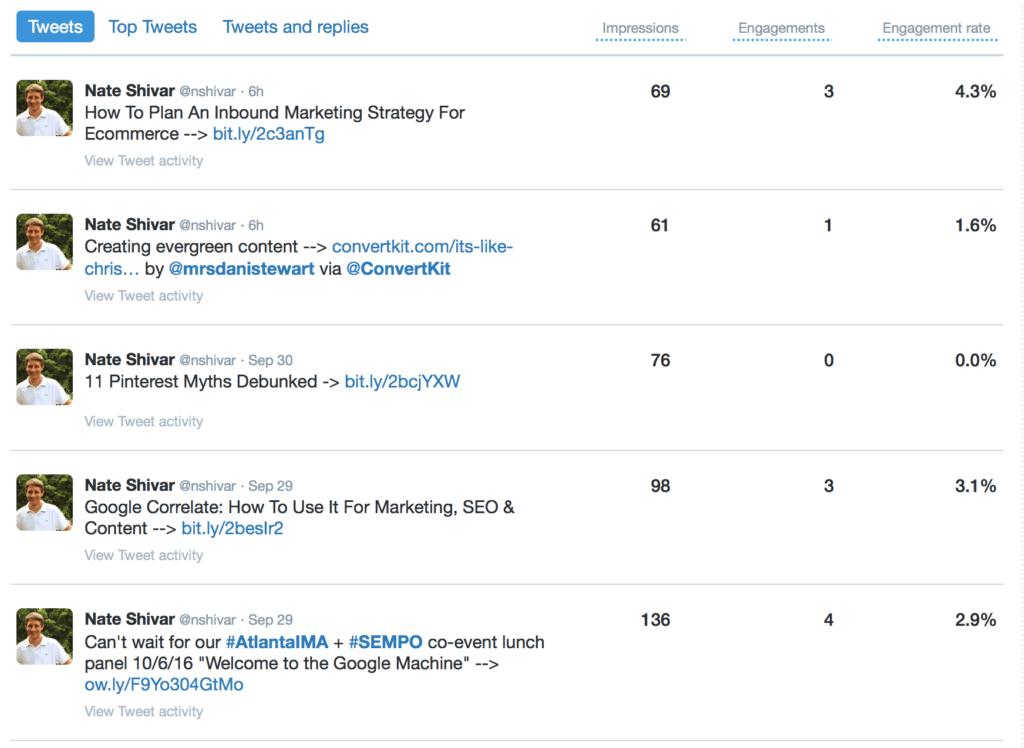
The table below the graph shows you every Tweet you made within the time period, as well as its number of impressions, engagements, and the engagement rate. You can also sort the table by Top Tweets, and Tweets and replies.
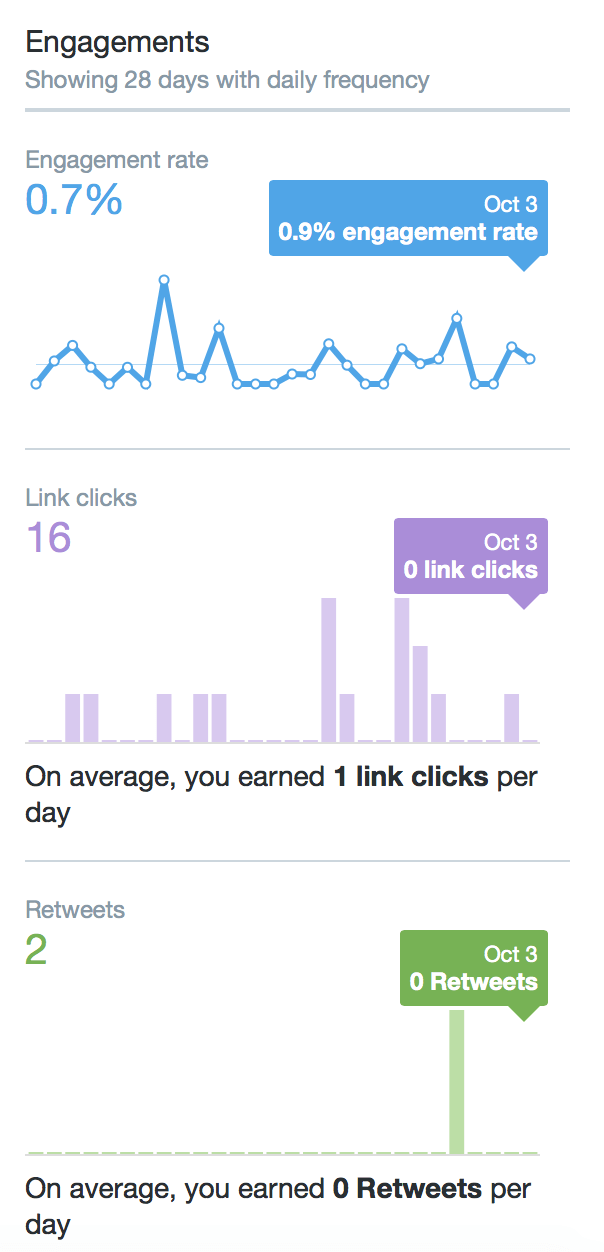
The sidebar breaks down engagements by the engagement type: i.e. link clicks, retweets, etc.
So, what can you do with all this data? A lot.
First and foremost, you can use the data to find the right Tweets to promote (or to spend money on).
Are there certain Tweets that are performing well but have limited impressions? If so, identify those cases, and see how paid promotion can help boost impressions and engagement.
You can also identify which types of Tweets work best for you and your goals.
Which do people usually engage with the most? Is it your blog content about your products, or is it the broader awareness content you write? Which types of Tweets get people liking, sharing, and clicking through to read what you have to say (or see what you have to sell). Find which type of Tweets work, and Tweet more of those!
You’ll also learn a lot about how Twitter fits into your overall strategy.
Unless you’re a Kardashian or some other celebrity big-wig, people don’t really care about your Tweets.
People care about your content and how you fit into their lives. Unless your Tweets are doing this (or have hit some humor jackpot), people aren’t going to waste their time reading or engaging with them.
Until January 2020, Twitter also provided Audience insights into your followers. But that tab as been removed.
Understand & Use Conversions
Under the “More” tab, you’ll find conversion tracking.
This enables you to measure how your Twitter followers interact with your promoted Tweets. So, if someone clicks on a your Tweet and then converts, or clicks on your Tweet, visits your site, and then converts within your specified window of time, Twitter Analytics will show it.
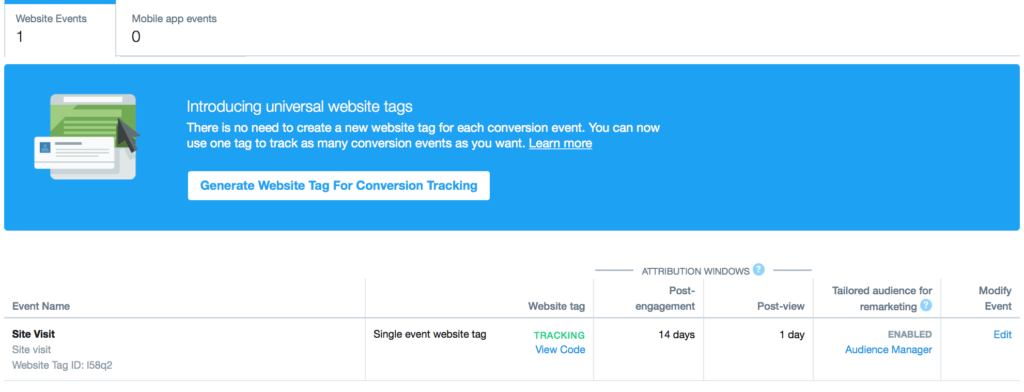
Back in the early days of Twitter Analytics, you used to have to generate multiple website tags for conversion tracking. Now, you can use one tag in the global header of your website to track as many events as you want.
After you generate the website tracking code and install it on your site, you can set up conversion events. These refer to the actions you want to track. You can use whichever actions you want to note; even more than one! These “conversions” break down as follows:
- Site visit – A user visits your site
- Purchase – A user completes a purchase on your site
- Download – A user downloads a file from your site (think webinar or whitepaper)
- Sign Up – A user signs up for a service, such as a newsletter
- Custom – A catch-all category for any custom action that isn’t included in the above
Name your event first. Be as specific as possible.
For example, if you’re tracking website visits from your Fall tee-shirt sale, name the event fall tee-shirt sale 2020 – website clicks. Next, select the type of conversion you want to track. For this example, it would be site visit.

After you have your event name and conversion metric, you’ll want to specify the conditions that should Twitter should track. For example, say you want to track website visits to a certain page called Brown Shirts. You can specify the condition as URL contains: brown-shirts to tell Twitter to only track the site visits to that page.
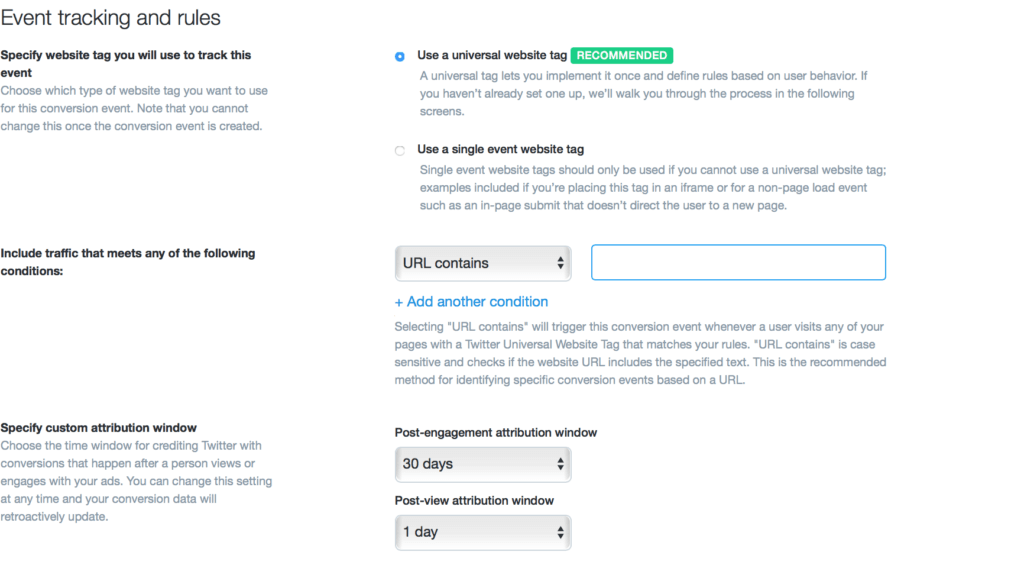
Once you’re done setting the conditions of your event, it’s time to set the attribution window.
This tells Twitter how long after an engagement and view they should attribute a conversion to. In the image above, I have mine set to 30 days for engagement and one day after viewing the ad. This means anyone outside of these time parameters will not be counted toward my conversions for this campaign.
Finally, accept the terms and conditions, and you’re ready to go! Now you can apply certain audiences to your event, or ask Twitter to tailor your audiences for retargeting purposes.
Next Steps
Aside from the obvious benefit of making your Twitter campaigns better, Twitter Analytics is a great way to understand your followers and even improve your marketing efforts elsewhere. To get started, check out these next steps:
- Determine if Twitter is right for you. If your audience isn’t here, don’t waste your time! There are plenty of other effective social media platforms you can dive into.
- Set up Twitter Analytics. You should start tracking from day one, or as soon as possible, to have baseline data.
- Get tweeting. Like lots of content, tweets can be trial and error. Try out a few different approaches, see what works best, and optimize the ones that don’t.
Read more about 14+ Website Marketing Data To Track Now or Lose Forever


