You already know social media analytics can be a powerful tool in your marketing toolkit. Not only can they tell you about how your content performs on social (like Twitter & YouTube)… but the data can also give you tons of insight into your target audience and new potential business opportunities. Pinterest is no different.
Pinterest Analytics is a powerful social media tool that allows you to see what people Pin from your profile and website, as well as what your audience enjoys to pin outside of your own content.
Sound enticing? Great — getting started is easy. All you need is a business account on Pinterest with a verified tag.
As long as you have this set up, just sign in with your credentials and click on the Analytics tab in the top left corner of your account homepage to get started! You can also log in directly at analytics.pinterest.com
Once you get here, you’ll see a dropdown menu of four areas to explore within Analytics: Overview, Profile, People you Reach, and Website. I’ll break each one down into more detail. But before we dive in, let’s get some definitions down.
Pinterest Analytics Definitions:
Here are some key metrics you’ll find in your Pinterest Analytics account:
Impressions
The number of times a Pin showed up in the Home Feed, search results, and category feeds.
Clicks
The number of clicks to your website from Pins on your profile.
Average monthly viewers
The average number of people who see your Pins.
Average monthly engaged
The average number of people who act on your Pins (either through Repinning or Clicking).
Understand & Use Your Overview Tab
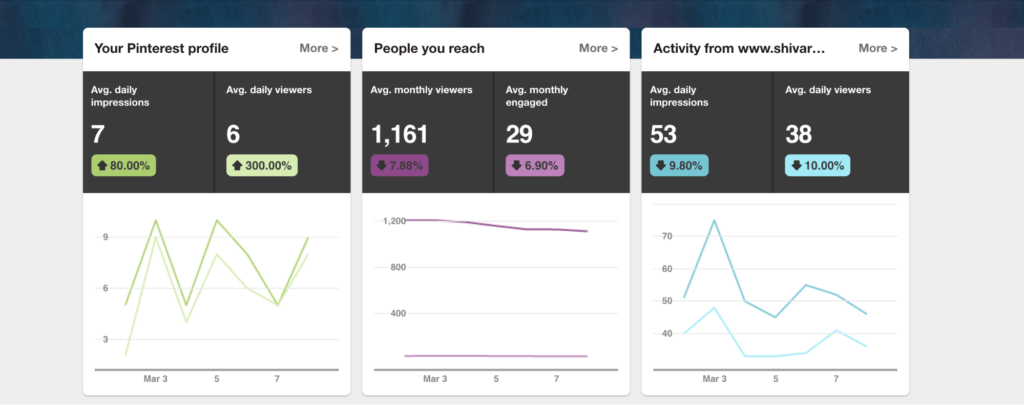
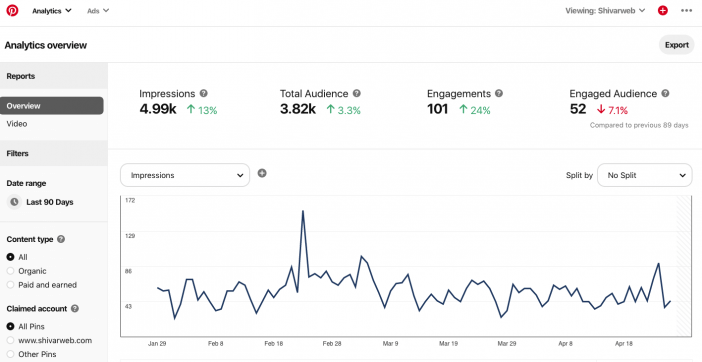
The Overview tab in your Pinterest Analytics account is a great way to get a snapshot of the segments Pinterest is capturing data from: your Pinterest profile, the people you reach, and activity from your website.
Pinterest breaks each of these categories into time-dependent data that is compared to another data point. For your Pinterest profile, it’s avg. daily impressions (the number of times your pins from your profile showed up in the Home Feed, search results, and categories) versus the avg. daily viewers of your pins.
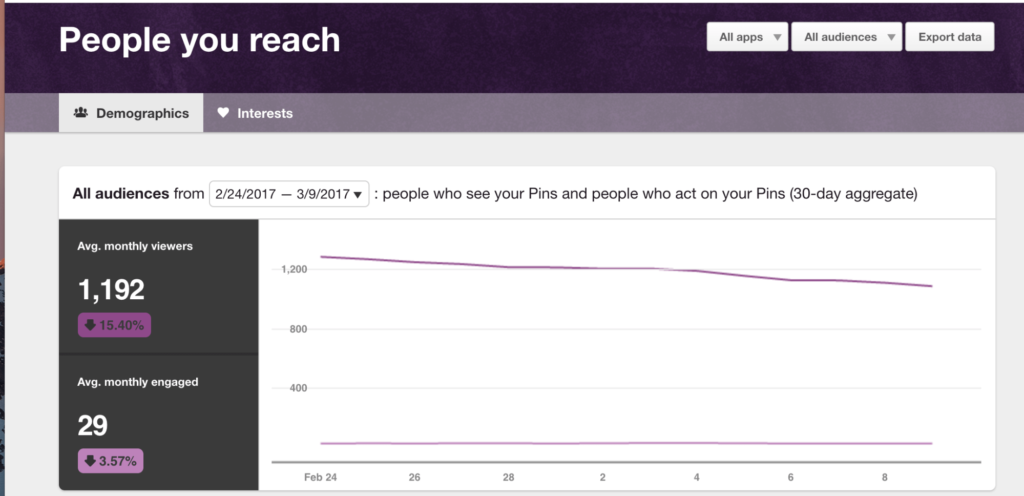
Under people you reach, you can compare your avg. monthly viewers against the avg. monthly engaged (or the avg. number of people who took actions on your Pins).
Lastly, your website data shows avg. daily impressions of Pins from your site vs. avg. daily viewers.
The Overview tab also gives you a look at the top performing Pins from your website:
The chart shows the top Pins from your website, sorted by impressions. It also breaks down engagement by saves, clicks, likes, and Pin type (if you choose to set it).
Each of these overview snapshots let’s you click through to see more detailed information under each category, so I wouldn’t recommend using the Overview tab as an in-depth look at how your Pins are performing.
However, if you want an easy way to check in on how your account is doing throughout the month, this is where you’ll get it. Let’s dive in now and take a deeper look at what this data actually means for your business.
Understand & Use Your Pinterest Profile Data
The first in-depth view Pinterest Analytics offers is for your Pinterest profile. These insights take a look at the Pins you create directly in your profile (versus those others can create from your website).
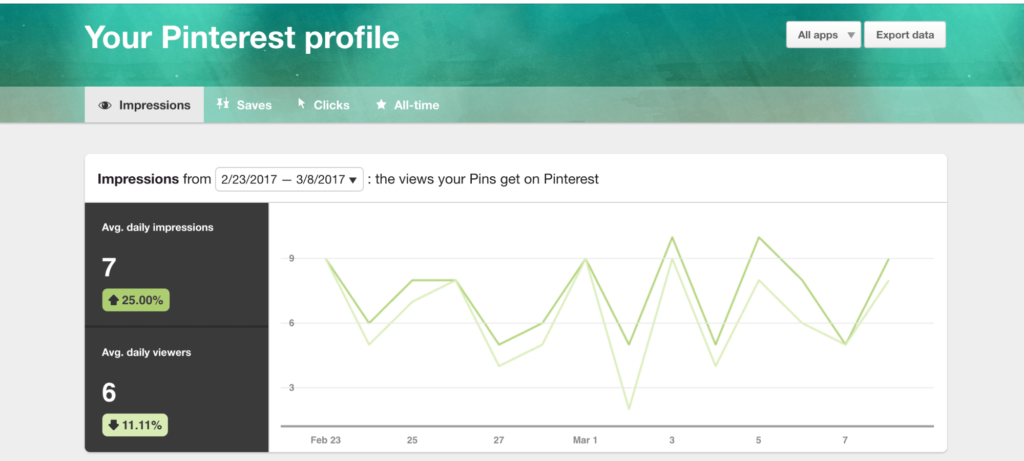
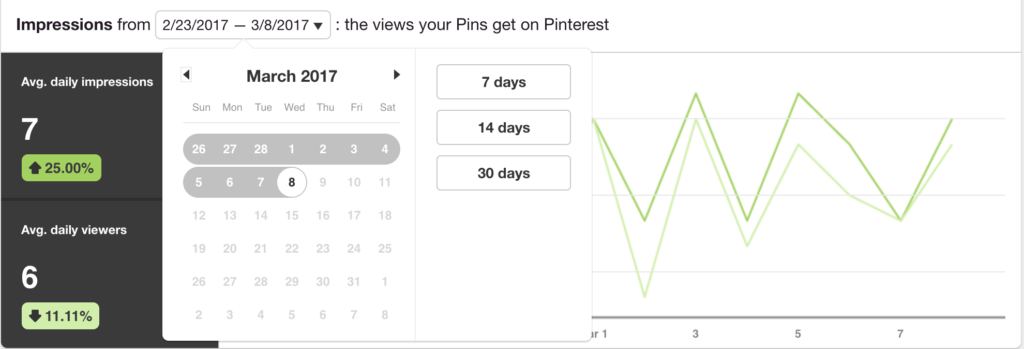
As you can see, Pinterest gives you a few different options right when you click into the tab. The default view is the Impressions/Viewers comparison graph that we had in the Overview tab. However, Pinterest now gives the option to change the date range for this comparison.
You can choose from 7 days, 14 days, and 30 days, or use the calendar to choose a date range.
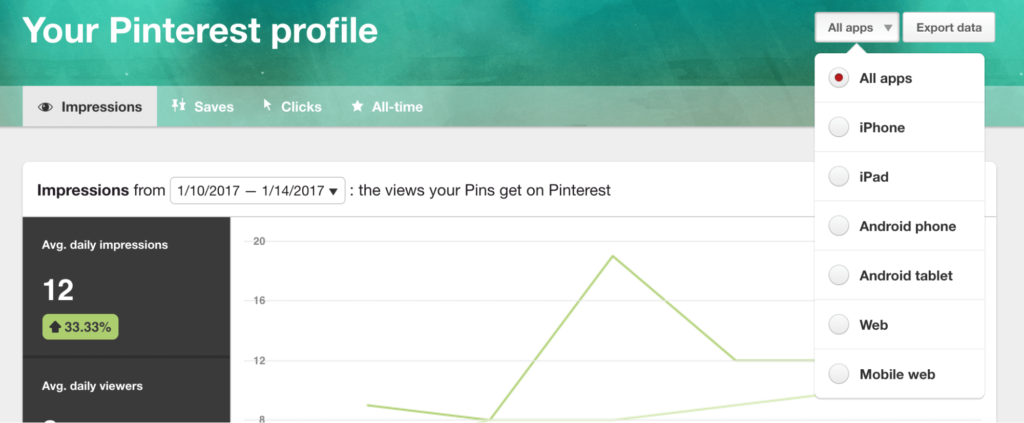
You can also filter impressions by device-type to see where Pins are performing best. Just select “All apps” in the upper righthand corner (which is the default view), and then choose which device you want to evaluate.
You can use this information to optimize your pins and your website based on the popular devices. For example, if a large percentage of your impressions are coming from iPhones, you’ll want to be sure your Pins and the areas of your site they link to look great on an iPhone.
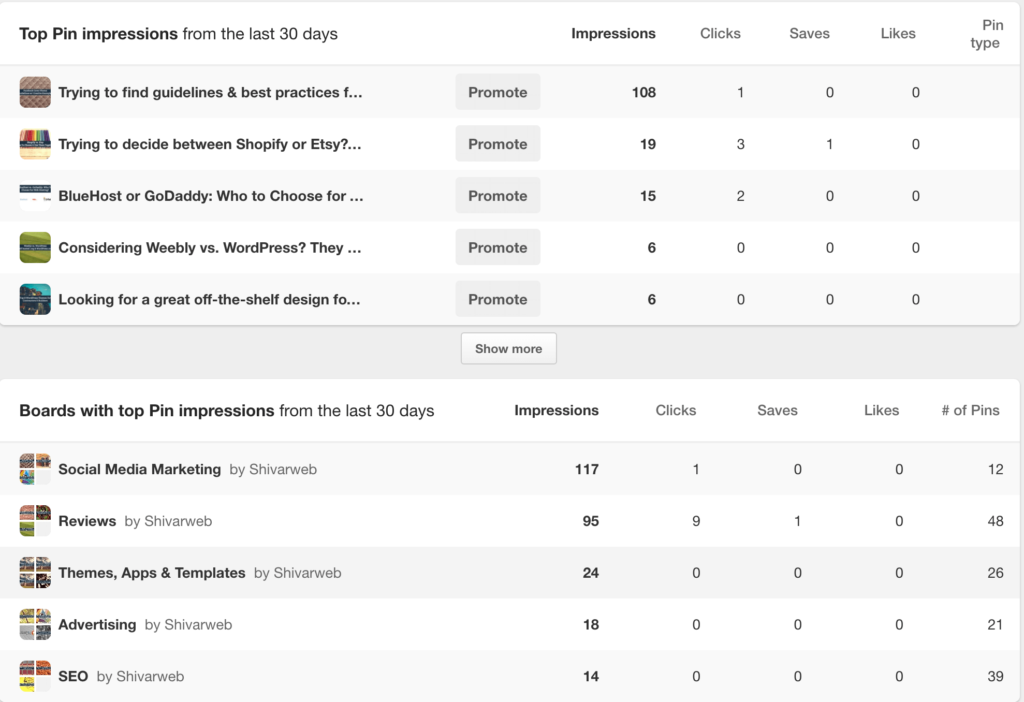
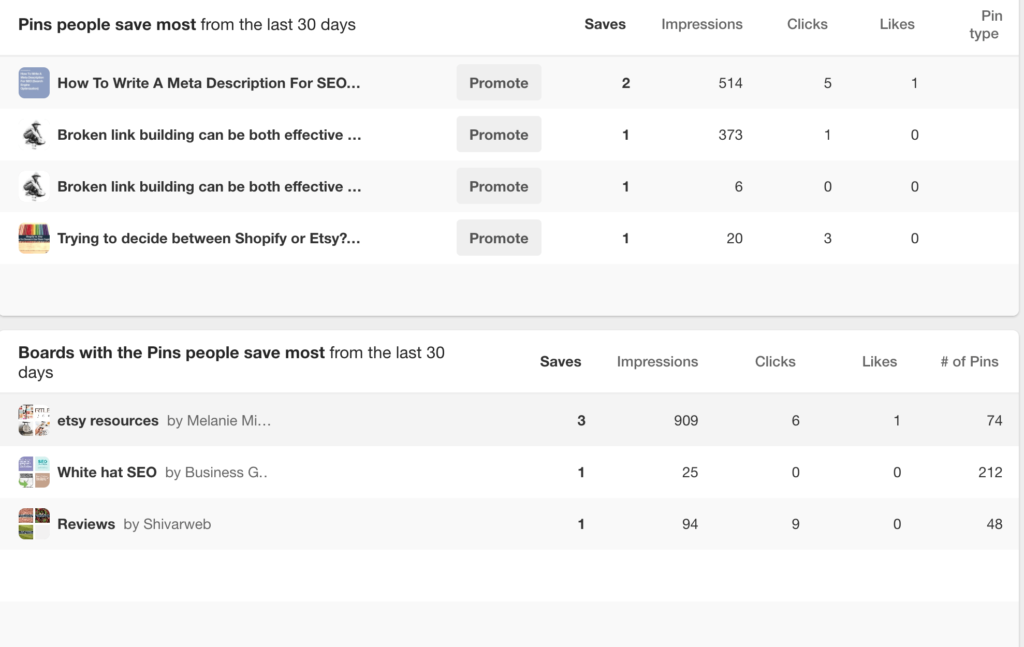
Below the chart, Pinterest gives details on how individual Pins and Boards are performing. This is broken down into Top Pin impressions from the last 30 days and Boards with top Pin impressions from the last 30 days.
Top Pins is a great way to look at how individual pins are performing not just from an impressions standpoint, but also in terms of clicks, saves, and likes. It also gives you the ability to promote a Pin that has a limited number of impressions but several clicks.
For example, in this view, I can see that my Shopify vs. Etsy Pin and Bluehost vs. GoDaddy Pin both have a higher click to impression ratio than my other Pins. If I want to get more life out of these posts, I can give them a boost by hitting “Promote”.
Similarly, you can use the Boards data to see which of your topics/categories is garnering the most interest. For me, the Social Media Marketing board has been seeing a ton of impressions, but Reviews is seeing the highest number of clicks (which makes sense when compared with the two highest clicked Pins from above – both of them were pinned to my Reviews board).
If I want to use this data to inform my next editorial calendar, it would be safe to say my Pinterest audience is really enjoying my reviews of tools, and I could create more comparison posts to feed their thirst for this info.
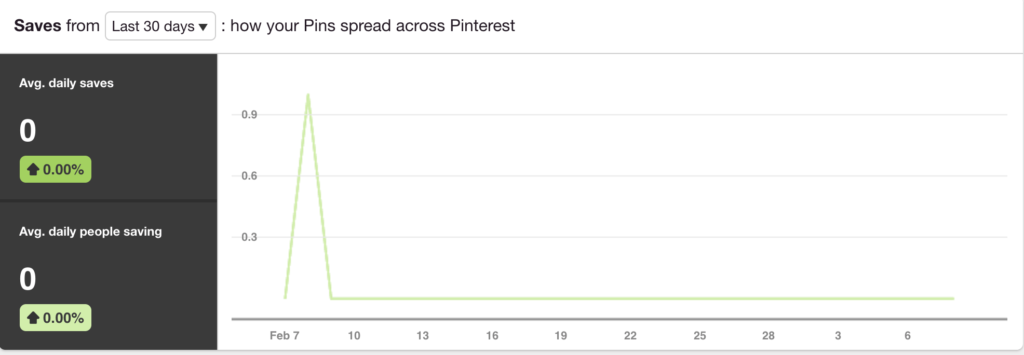
While the Impressions view seems to have it all, you’ll want to toggle into each metric to get the most out of your profile analytics. Pinterest enables you to look at Saves, Clicks, and All Time data.
Saves and Clicks give you the same breakdowns as the Impressions tab, but instead of ranking your Pins and Boards by impressions, they are ranked by saves or clicks depending on your view.
These views also give you a graph to compare avg. daily clicks/saves to avg. daily visitors/viewers:
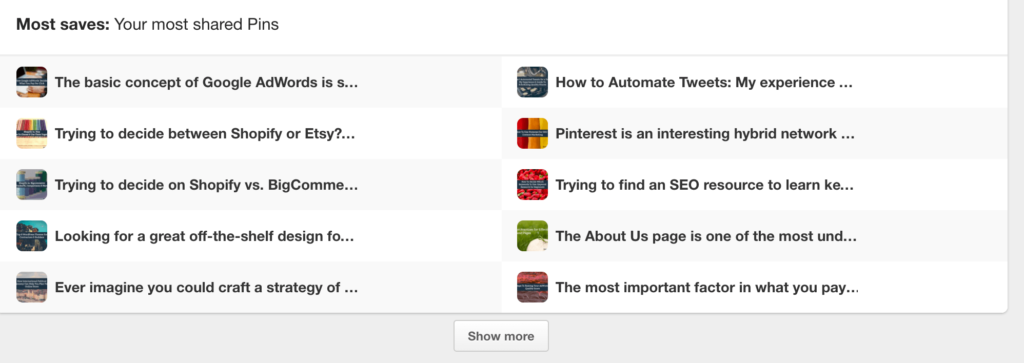
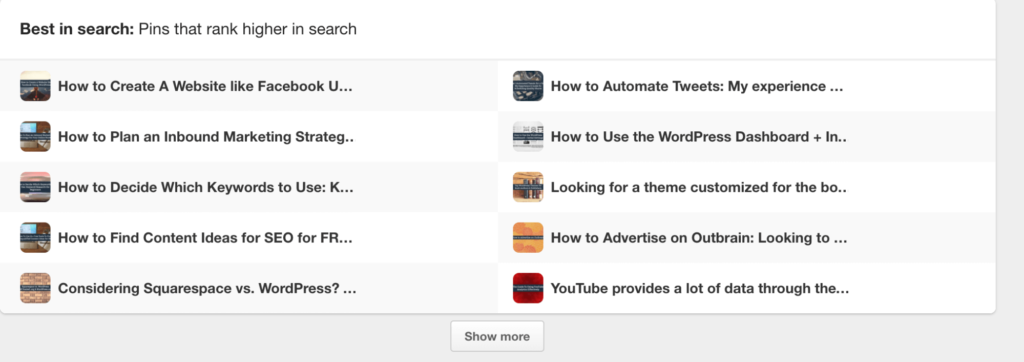
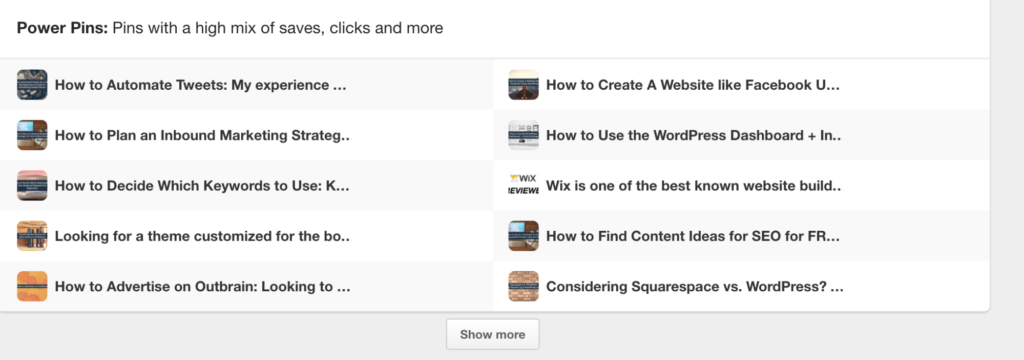
The All-time view, on the other hand, shows your best performing Pins of all-time. Pinterest breaks this down by the most-saved pins, your Pins that rank highest in search, and “Power Pins”, or Pins that have a high mix of engagement metrics like saves and clicks. You can use this data to evaluate all of your Pins depending on various goals: engagement, search, or Repinning.
No matter what view you’re in, you also always have the option to export the data into a spreadsheet by clicking “Export data” in the top right corner:
Understand & Use Your “People You Reach” Data
In order to fully understand how your Pins are performing (and optimize your Pinterest account to be effective for your business goals), you need to understand your audience. The “People You Reach” tab of Pinterest Analytics helps you do just that.
**As of October 2018, Pinterest is granting Early Access to the new Audience Insights tool. It is very similar, but more powerful and more intuitive than People You Reach.
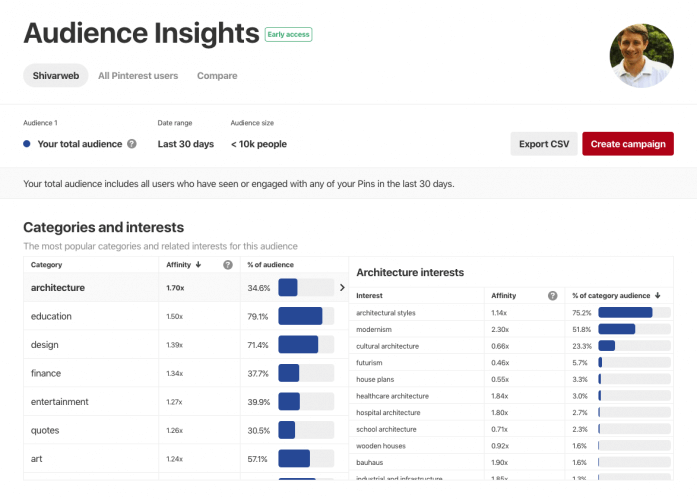
Until it’s rolled out further, it helps to be familiar with People You Reach, which has not changed since 2017 (hence the old screenshots).
The first thing you see when you enter the “People You Reach” area of Pinterest Analytics is demographic information.
Right of the bat, Pinterest sorts your audience into avg. monthly viewers (anyone who has seen your Pin), and avg. monthly engaged (anyone who has taken an action on your Pin). This gives you a broad overview as to how your pins are performing for your entire audience. If you want to see how your views/engagement ratio is for people who follow your page, toggle the audience to “Your Followers”.
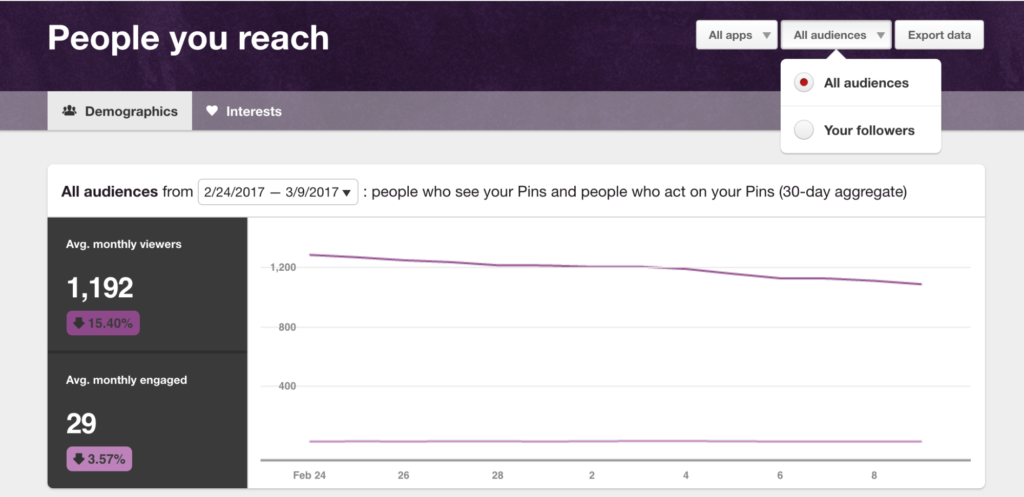
You can use this segmented view (along with the application segment view) for the rest of the demographic information as well, which is where the good stuff is.
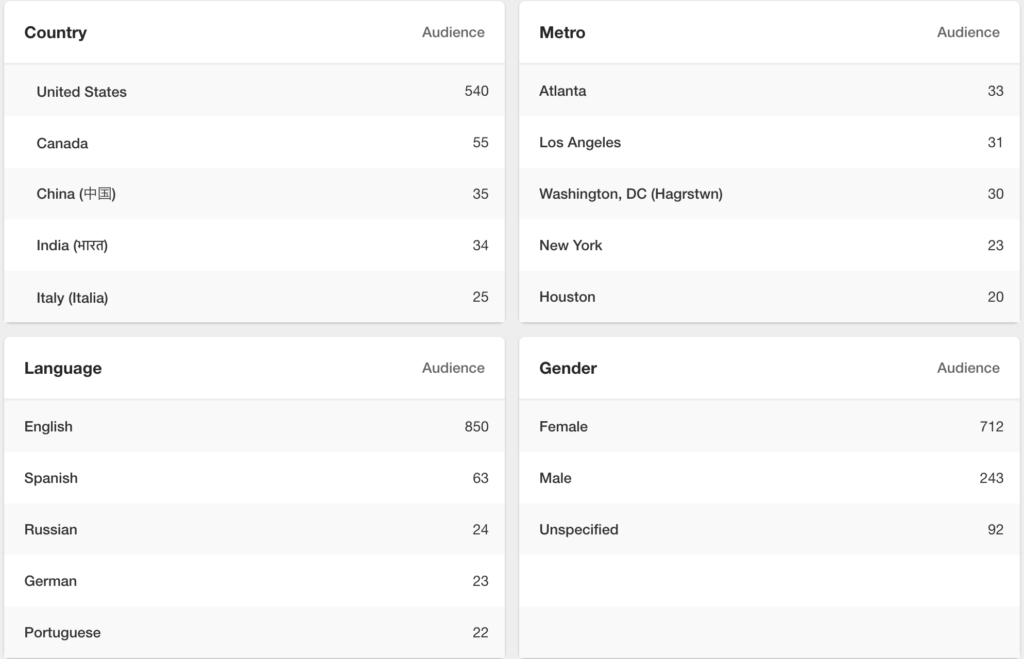
As you can see, Pinterest breaks down audience demographics into four categories: Country, Metro, Language, and Gender. You can view this data for your entire audience (people who view your Pins and followers), or just for your followers.
Keep in mind that this data is just for the past 30 days, so you’ll want to note major changes over time. However, even monthly demographic data can be incredibly useful for planning your Pinterest strategy.
For example, if you see a large percentage of your audience speaks Spanish, you may want to consider the marketing opportunities in Spanish-speaking cultures. Conversely, if you’re a small eCommerce store that only does business in the U.S., and you see a large amount of your Pinterest audience resides in Italy, you may want to rethink your Pins and promotions to more tightly align to your target market.
Aside from demographic info, Pinterest Analytics also provides a look at your audiences’ interests, the boards your Pins are associated with, and the businesses your audience engages.
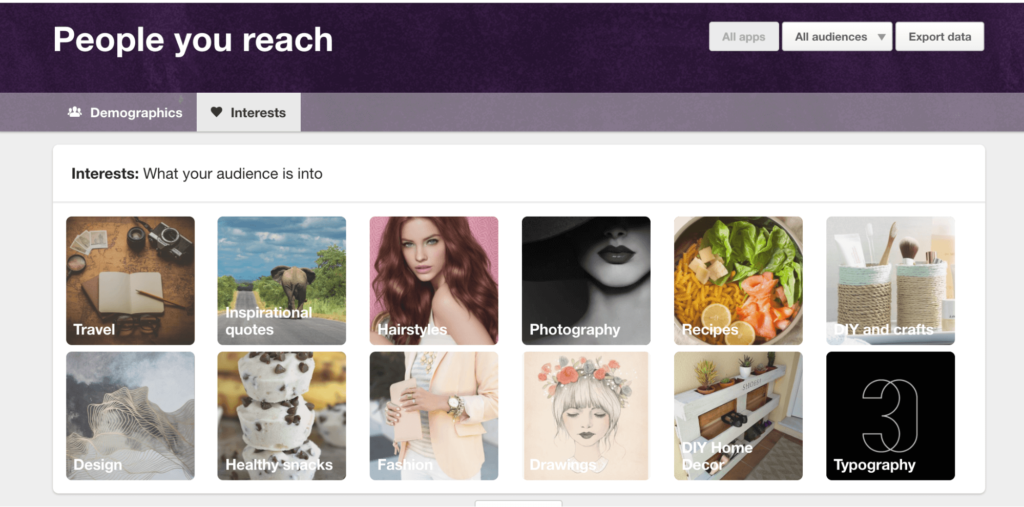
Let’s talk about interests first. When you first view the “Interests” tab, you’ll see an overview of various interests your audiences have:
Again, you can toggle this view to be focused on your entire audience or just your followers, which can provide a more qualified view.
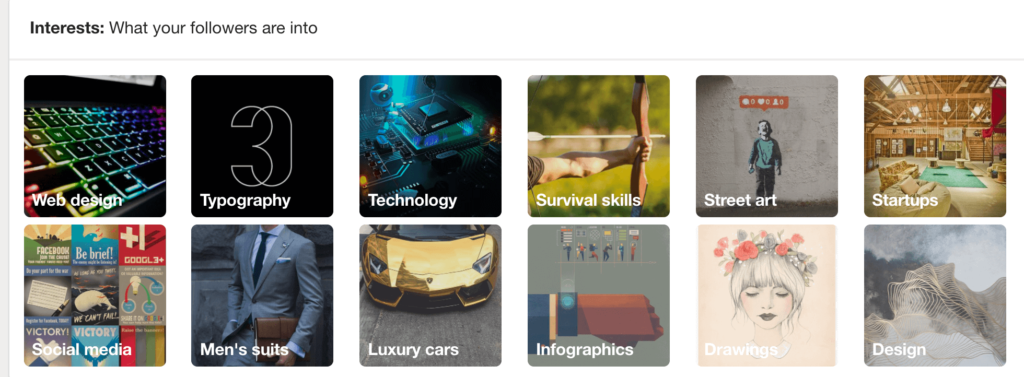
For example, here I see that my overarching audience is interested in travel, inspirational quotes, and hairstyles. None of those topics are useful in terms of the content I’m pinning. However, if I look at my Followers’ interest, I can see how to better engage the people who have already shown interest in my business:
At first glance, I can see this view is very different. I can identify a few opportunities right off the bat, such as infographics. If my followers tend to like infographics, I know I can use infographics as a way to communicate some of my content, because my audience is more likely to engage with it in that format based on their identified interests.
I can also use this information to inform the topics I write about — i.e., social media. If a lot of my followers express interest in social media, I can create content that caters to that interest and enhance engagement for those who have already expressed interest in my profile.
Interests aside, Pinterest also gives some interesting insight into the boards your Pins appear on and the brands your followers interact with.
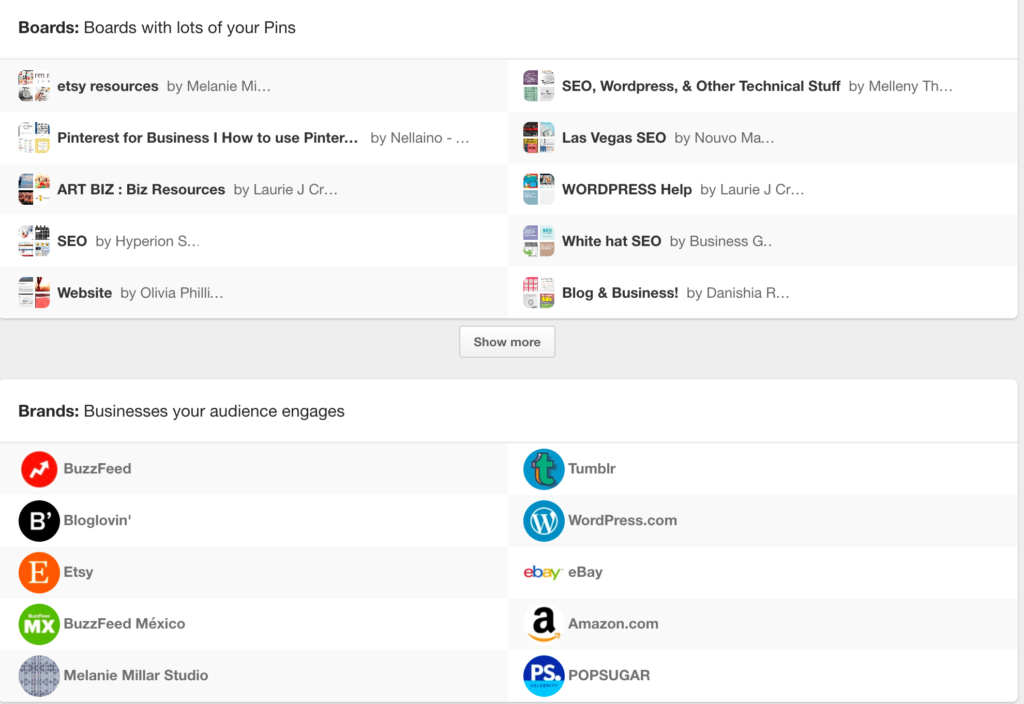
Again, you can sort this view by “all audiences” or “your followers”. Here, I’m looking at all audiences. I can see that there are a lot of SEO boards where users have Pinned my Pins, as well as WordPress Boards. This helps inform my targeting and the type of Pins I create for broader audiences, as well as the way I organize my own boards and website. If I see my audience is organizing my Pins in a certain way (i.e. SEO, Website, WordPress, Etsy), I can take a look at my own profile and make sure my content is organized in a similar way.
In the “Brands” section, I can see where my broad audience engages. This can help me identify types of content my audience likes, as well as brands I can partner with to create mutual engagement and attraction.
Understand & Use Your Website Data
If you want to know how content from your website itself is performing on Pinterest, this view is for you. Not only can you see the Pins you’ve added to your own profile here, but you can see data for all of the Pins that link back to your website. For example, if a website visitor loves your blog post that they Pin it to their own board, this where you’ll see the data from that type of interaction.
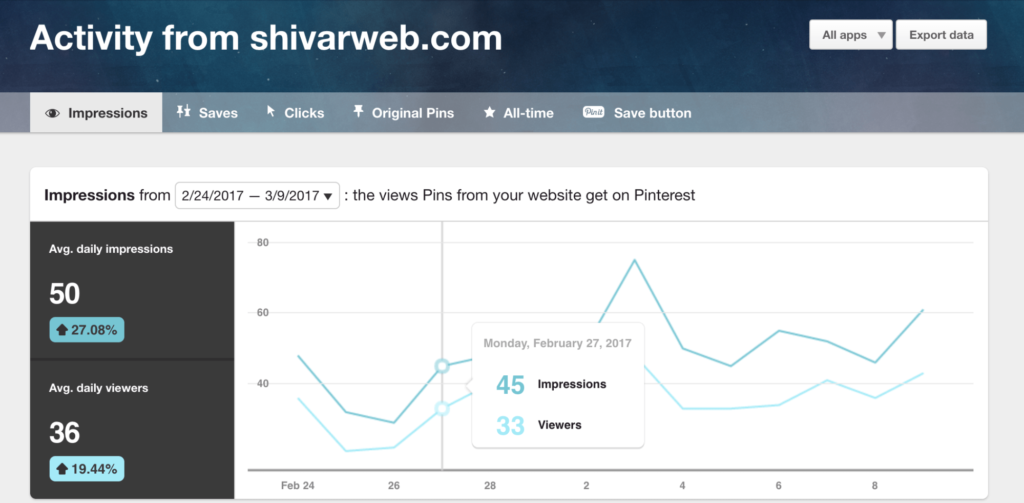
When you first navigate to the “Website” tab, you’ll get an overview graph much like those in the other Analytics tabs.
Pinterest automatically sets your data on “impressions”. As you can see from the graph above, Pinterest charts your average daily impressions against your average daily viewers. You can change the date range at the top of the graph, and you can drill down to a certain app type to see how your impression/viewer ratio differs across devices.
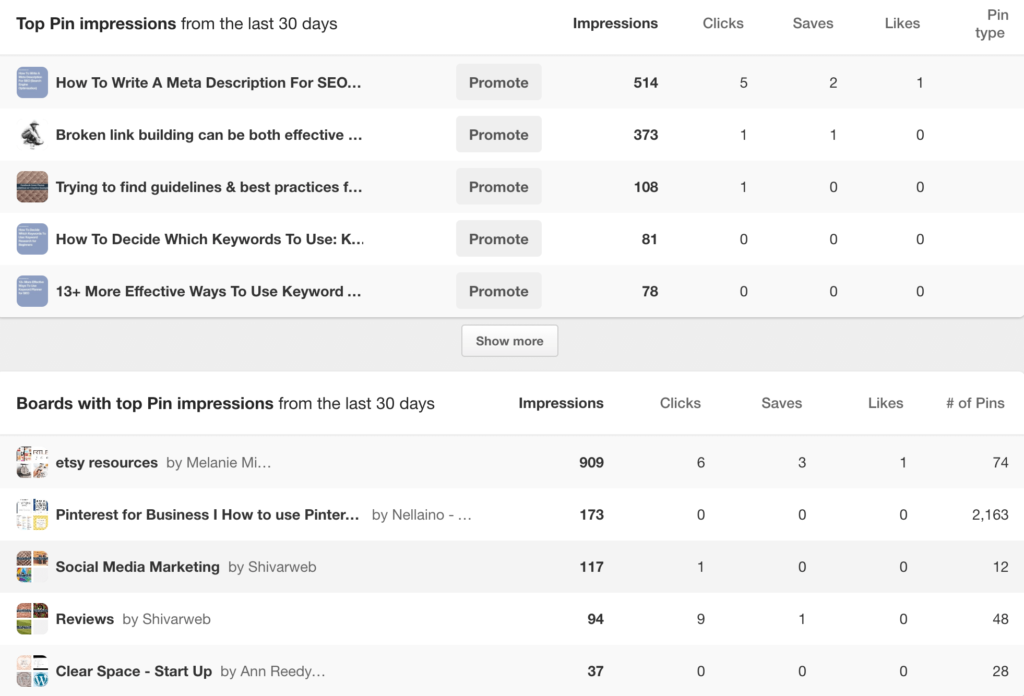
Below the graph, Pinterest gives you detailed information about your Pins and Boards where your website content is saved.
In Pins, we’re looking at the most popular content (or products, videos, images, etc.) on your website. You can use this data to determine which content you should turn into a Pin on your own profile, as well as what your audience is interested in.
For example, if you sell pet apparel for dogs and see that your small dog sweaters are a top Pin, you may want to make a board featuring all the small dog sweaters you have in store. You’ll also definitely want to be sure you have that product in stock for your customers.
Boards, on the other hand, show where others are putting Pins that link to your website. You can use this information to figure out how people organize your content, as well as how popular consumers think about your content.
For example, say your small dog sweaters are typically pinned on a Rescue Dog board that gets a ton of impressions. You can use this information to help inform your marketing strategy and reach new audiences (i.e. rescue dog supporters who want to be sure kennel dogs stay warm in the winter).
Note that since we’re still in the impressions view, my Pins and Boards data are ranked by impressions. However, if I’m more interested in look at Saves, I can change the view at the top of the page to Saves and see the data sorted that based on people who have “saved” Pins that link back to my website.
Like all analytics, you’ll want to have a goal in mind or a problem you’re trying to solve before diving into the data. This will help inform what view you want to use to filter your insights.
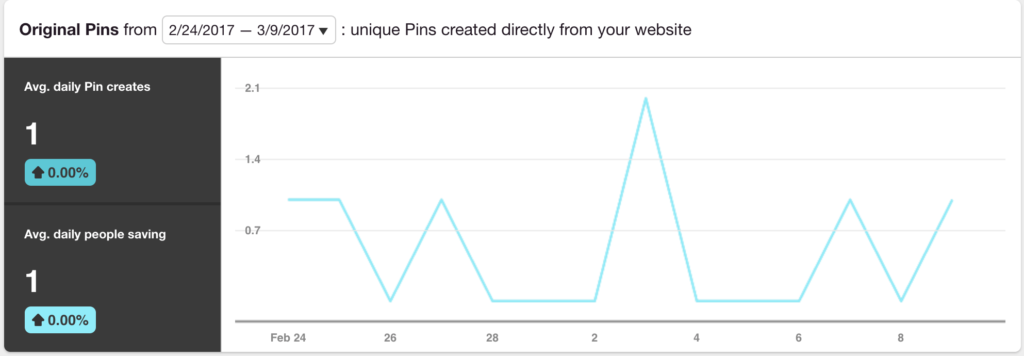
Aside from Impressions, Saves, Clicks, and All-time data, Pinterest also gives you a look at Original Pins and Save button insights. Let’s start with Original Pins, which deals with the number of unique Pins created from your site on a daily basis:
As with the other views, Pinterest gives us a graph that compares avg. daily pin creation with avg. daily people saving your pins. This is a great way to see if your audience is creating more than one unique pin on average.
Next, you can see the newest Pins created from your site, which helps identify trends in the type of content being Pinned from your site.
Overall, the Original Pins section is great for evaluating your site content in isolation. It’s all about taking a look at how people share your website content with Pinterest, versus how people connect Pins to your site. This data can help you evaluate how easy it is to Pin from your site (i.e. is your Pinterest “Pin It” button visible on all of your content?), as well as how well your site works across different devices.
For example, you may notice by sorting by “iPhone App” that your unique Pins decrease significantly, indicating inadequate mobile Pinning experience. Given 75% of Pinterest takes place on a mobile device, you’ll want to make sure your “Pin” button and functionality are seamless when your audience is viewing your site on their iPhones and other mobile devices.
Lastly, your Website data allows you to evaluate referral traffic from the “Pin It” button on your site. If you’re using the official “Pin It” button on your content, this view will give you a peek at how that button drives traffic back to you.
For example, if users pin your small dog sweaters, you can see how much traffic is driving back to your site by other Pinterest users clicking on those Pins. This allows you to get an overarching view into how Pinterest is driving traffic to your site, versus how your site is driving traffic to Pinterest!
Next Steps
Aside from the incredible audience and Pinterest profile data you can glean from Pinterest Analytics, this data platform is a great way to understand how your followers and your potential audiences interact with your content, both on social media and on your site.
By thoroughly understanding how users organize, share, and save your content, you can optimize the type of content you share on Pinterest and your website to better serve the wants and needs of those audiences.
To get started, check out these next steps:
- Determine if Pinterest is right for you (to focus on). If you’re an eCommerce business, chances are there are some great opportunities for you. However, if you’re in the legal profession, your audience might not be here. If your target audience doesn’t spend their time here, neither should you!
- Set up Pinterest Analytics by creating a business account. You’ll want to start tracking data from day one to have a baseline to compare your progress to. Don’t forget to add the “Pin It” button to your site, too, so you have website data.
- Get Pinning! Create boards, share original content, and repin others when it make sense. Try a few different approaches, see what works for your audience, then optimize, optimize, optimize! And don’t forget to use the data to inform your website strategy. Use a paid tool like Tailwind to help automate some tasks.
Read more about 14+ Website Marketing Data To Track Now or Lose Forever
